Launch offer: each Brain, report and chat included, ₹9,999 (₹14,999). Offer ends 31 October 2026.

Why buyers switch, and which brands win them

Whey Protein India 2026

Why Indian buyers choose, switch and leave whey and protein supplement brands, and how those brands compete on price per gram, proof and positioning.

Built from 1,700+ Indian buyer conversations (2024–2026) and dated listings across 9 storefronts, checked against independent market research.

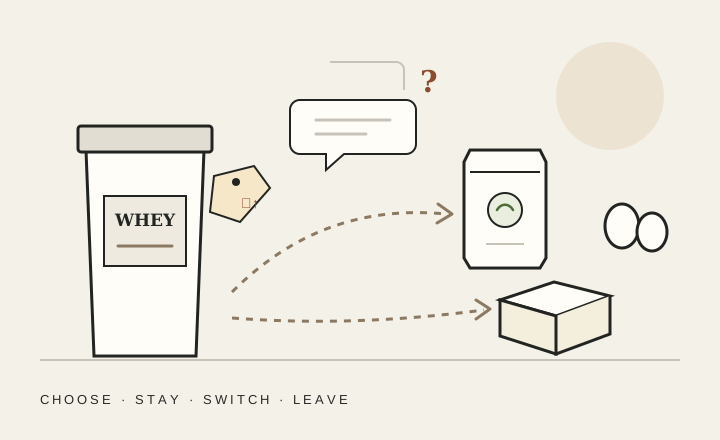
A whey tub with a rising price tag, and dotted paths to yeast protein, paneer and eggs
$860M+
Market value (2024)
IMARC Group estimate
29%
Decisions triggered by price
Top trigger; trust 18%, digestion 15%
45%
Traceable switching leaves the format
Whey to yeast, plant or food
4.7×
Spread in price per gram of protein
₹1.88/g to ₹8.87/g
35%
Listings that disclose enough to compare ₹/g
N=17 listings
+63%
Amul switching balance
Largest net gainer among brands

Evidence basis: what buyers say they did and why, in their own words. Market data comes from independent research, cited in the report. Owned claims, listing reality and customer discussion are kept as separate evidence layers.

In buyers' words

What buyers are saying

Jab hamari bari agyi body banane ki to price double hogye

Just when it was our turn to build a body, prices doubled

On MuscleBlaze moving from about ₹1,700 to ₹3,200
Buying a gun is easier than buying original whey protein
On the fear of fake whey
Switch to yeast protein. That's easier on the gut
Advice to someone who cannot digest whey
Switched to Amul from MB n for me it's going good... I'm loving it tbh
A buyer who left MuscleBlaze
01

Executive synthesis

The evidence supports five findings. Each is falsifiable and rests on the evidence base, cross-checked against independent market research where possible.

How to read the numbers
Headline figures are shares; every exhibit in the full report states its base. Individual switching routes are labelled by signal strength instead of a count: Strong signal (8 or more captured events), Recurring pattern (3–7) and Illustrative case (1–2, shown for the mechanism and the buyer's words, not for size). All figures describe this public-conversation corpus, not the market as a whole.
01

Protein decisions are organised around three recurring needs, none of which is "buy whey."

Three distinct needs drive protein decisions: finding protein they can trust (52% of need-coded buying decisions), avoiding digestive discomfort (41%) and getting protein conveniently (7%). Competitor sets, reasons to stay with or drop a product and winning brands all differ from one need to the next. Two further needs are emerging but have small evidence bases.

Evidence · Corpus metric. 197 buying decisions across 3 needs from 182 independent sources. In 57% of them the need is inferred from the stated trigger rather than stated outright.

Free sample from the full report

Why buyers act: the triggers behind protein decisions

Exhibit 4

Decision trigger hierarchy

Primary trigger, share of decision events
Price
29%
Trust
18%
Digestion
15%
Taste
10%
Other
9%
Ingredients
5%
Performance
4%
TriggerShare of eventsPrimary role
Price29%Drives switching and purchase entry
Trust18%Consideration barrier + rejection driver
Digestion15%Hardest exit trigger; causes category-level churn
Taste10%Brand substitution within same format
Other9%Mixed: availability, lifestyle, recommendation
Ingredients5%Clean-label anxiety; overlaps trust
Performance4%Results-based evaluation
Source: Built from 1,700+ Indian buyer conversations (2024–2026) and dated listings across 9 storefronts, checked against independent market research.
25 more sections in the full report

Continue beyond the preview

One purchase gets you the full report, the licensed PDF and chat with this Brain's data: ask your own questions and see the quotes and sources behind every answer. Three months of access. The final total is shown at checkout.

₹9,999Full price ₹14,999Save 33%

Launch offer ends 31 October 2026. Full price after that.

Ask the cohort

The segments that move this market

6 segments, each defined by what people want and measured by what they do against the whole market. Here are 2 of them; the full Brain opens every one and lets you ask them your own questions.

Segment

Proof seekers

They research 1.4× and rule products out 1.6× as often as the market, and switch half as often. The biggest segment stalls at the gate: proof, not price, decides whether they buy at all.

  • 1.6×Rule products out more often than the market
  • 1.4×Shortlist and research more often than the market
“i have seen lots of people doing promotional stuffs for that medicine but didnt saw any one doing lab test for that company”

Segment

Price re-shoppers

They buy 1.8× and switch 1.3× as often as the market, and quit less. They never leave the category, only the product: every purchase is a fresh price comparison.

  • 1.8×Buy more often than the market
  • 1.3×Switch more often than the market
“no doubt the protein is top notch but 13k is too much.”
  • In the full BrainTaste fixers
  • In the full BrainGut-led switchers
  • In the full BrainResults trackers
  • In the full BrainDelivery-burned buyers

Open all 6 segments and ask them your own questions

  • What each segment does more, and less, than the rest of the market
  • Who counts in each one, so you can find them in your own data
  • Answers from that segment's evidence alone, with the quotes behind them
₹9,999Full price ₹14,999Save 33%

Launch offer ends 31 October 2026. Full price after that.